11 April 2016
Producing Wrong Data Without Doing Anything Obviously Wrong!
Authors: Mytkowicz, Diwan, Hauswirth, Sweeney
Conference: ASPLOS’09
Imagine you are working on a compiler optimization and benchmarking shows that it is effective: you obtain a nice speedup on a standard benchmark suite. However, your colleague, using another user account on the same machine with a seemingly identical setup, measures the opposite effect: a slowdown of the same magnitude as your purported speedup. Could this happen? If yes, why? This paper looks at the notion of measurement bias by which seemingly innocuous features of the environment can greatly effect the results of the experimental evaluation of a system.
Using an extensive series of experiments, the authors show that such measurement biases are both significant and commonplace in computer systems research. Here significant means that the bias can greatly affect the size of an observed effect and even its sign (i.e., whether we judge a change in the system to be positive or negative overall). Commonplace means that we must assume that such biases are always present; the authors’ evaluation shows biases across three CPU architectures (one of them simulated), two compilers, and most programs of a popular benchmark suite.
The question they looked at was the following: does the compiler’s -O3
optimization flag result in speedups over -O2? This question is
investigated in the light of measurement biases caused by two sources:
- Unix environment size, and
- linking order.
Environment size refers to the total size of the representation of Unix
environment variables (such as PATH, HOME, etc.). Typically, these variables
are part of the memory image of each process. The call stack begins where
the environment ends. This gives rise to the following hypothesis: changing
the sizes of (unused!) environment variables can change the alignment of
variables on the stack and thus the performance of the program under test
due to different behavior of hardware buffers such as caches or TLBs. (This
is the source of the hypothetical example in the first paragraph, which I
made up. On the machine where I am typing this, my user name appears in 12
of the environment variables that are set by default. All other things being
equal, another user with a user name of a different length will have an
environment size that differs by a multiple of 12 bytes.)
So does this hypothesis hold? Yes. Using a simple computational kernel the
authors observe that changing the size of the environment can often cause a
slowdown of 33% and, in one particular case, by 300%. On larger benchmarks
the effects are less pronounced but still present. Using the C programs from
the standard SPEC CPU2006 benchmark suite, the effects of -O2 and -O3
optimizations were compared across a wide range of environment sizes. For
several of the programs a wide range of variations was observed, and the
results often included both positive and negative observations. The effects
were not correlated with the environment size. All this means that for some
benchmarks, a compiler engineer might by accident test a purported
optimization in a lucky environment and observe a 10% speedup, while users
of the same optimization in an unlucky environment may have a 10% slowdown
on the same workload.
In order to gain confidence that these effects were indeed caused by changes in the stack’s starting location due to changing environment sizes, the authors also performed causal analysis: they fixed the stack to always start at the same address and kept varying environment sizes. The effects described above disappeared, elegantly ruling out other causes of the observations. (The situation is a little more complex for one of the benchmarks because it also copied the environment to the heap. See the paper for details.)
The results for the other source of measurement bias studied by the authors
are similar. The order in which object files are linked together influences
the addresses of both pieces of code and of global data. Alignment issues
may decide, for example, whether some hot loop can be placed into a single
instruction cache line, allowing the processor to execute it more
efficiently. The authors evaluated the same benchmarks using several
different linking orders: the original (as specified by the Makefile),
alphabetical, and 31 random orders for each benchmark. Again, the results
are mixed, and again, many of the benchmarks can end up with either speedups
or slowdowns when comparing -O3 against -O2.
Just to get the flavor of the results presented in the paper, here is a figure using violin plots to summarize the distributions of speedups and slowdowns for varying link orders:
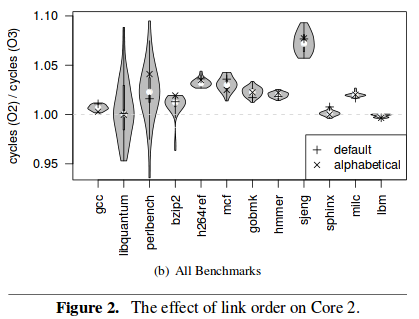
All of the results discussed so far were obtained using GCC as the compiler on a single machine. However, the authors also tested two other machines with different CPU architectures, one of which was a simulator. They also tested the benchmarks with the Intel C compiler to see whether it was more efficient at exploiting microarchitectural features to eliminate some of the biases. However, they found similar amounts of bias on all machines and for all compilers. Additionally, the bias was not predictable: for a given benchmark and compiler, different link orders and environment sizes gave the best performance on different machines.
What lessons can be derived from the findings of this paper? Systems researchers must be aware of measurement biases and of methods that help eliminate them or that allow them to draw solid conclusions even in the presence of biases. Three particular things are mentioned: first, the use of large and diverse benchmark suites. If the set of benchmarks is large and diverse enough, the various biases should cancel out statistically. The paper shows that this is not the case for the relatively small benchmark set they consider (but which is the basis of a lot of experimental work in compilers).
Second, setup randomization would run each benchmark a very large number of
times, varying the factors that introduce measurement biases. If done with
sufficient care, this should also result in statistical distributions that
allow the use of proper statistical methods. Using 484 different setups (22
link orders times 22 environment sizes) the authors produce distributions
for GCC’s -O3 versus -O2. With the t-test this allows them to conclude
that at the 95% confidence interval, -O3 results in a speedup of 1.007 ±
0.003. This is a speedup of less than 1%; compare it with the figure above,
where individual measurements might lead one to conclude slowdowns of 5% or
speedups of almost 10% for the same programs.
Third, causal analysis is a technique that tries to ensure that the right conclusions were derived from the given data. This can be done by designing interventions, running further experiments, and comparing the obtained results to the expected ones. This process allows one to gain confidence in the analysis of the data even in the process of bias. One example of causal analysis was discussed above: the hypothesis was that varying the environment size causes changes in the stack’s starting address, which itself causes changes in execution time. By fixing the stack’s starting address and obtaining constant execution times even when varying the environment size, the belief in this hypothesis was strengthened.
Overall this paper means bad news for people trying to use benchmarking to evaluate the (often quite small) effects of optimization on computer systems: there seems to be no easy way to identify and eliminate biases. The way forward must include both more careful benchmarking, using larger benchmark sets and randomized setups, and more careful analysis of the actual causes of changes in performance. The authors mention that more information and cooperation from hardware vendors would be needed for this, but systems researchers must also be willing to perform more careful experimental design than what we are used to.
(article written by GB)